We no longer support this browser. Using a supported browser will provide a better experience.
Please update your browser.
Research from the JPMorgan Chase Institute shows that the year-to-year growth of consumers’ everyday spending on most goods and services in 15 major US metropolitan areas has slowed dramatically, from 5 percent in the second quarter of 2014 to 0.5 percent in the comparable period in 2015.
This slowdown in everyday spending growth is one of several puzzling signals in the data on the US economy. Gross domestic product has increased every quarter except for Q1 2014 in the past four years, but in fits and starts. Unemployment is down and corporate profits have largely been solid. In real terms, retail sales have also grown every quarter since the 2009 recession, though inconsistently and at a slowing rate. Within the sector, spending growth has differed significantly by category. For example, auto sales have grown strongly in recent months, but several big chains and other merchants are forecasting a tough 2015 holiday season.
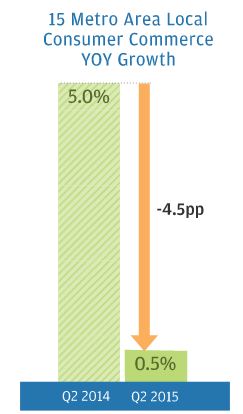
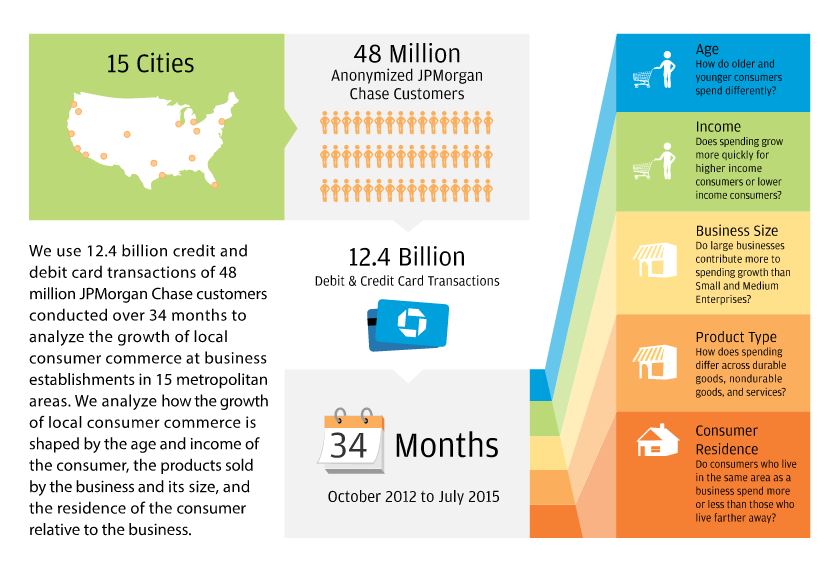
A new, powerful data asset—the JPMorgan Chase Institute “Profiles of Local Consumer Commerce”—allows us to shed light on these ambiguous indicators. With this new data set, we can analyze important characteristics of the transactions between consumers and businesses at the point of sale and at the neighborhood, city, and metropolitan-area levels. In this initial report, we use these data to explore the marked 4.5 percentage-point slowdown in the growth of local consumer commerce between Q2 2014 and Q2 2015 across 15 metropolitan areas nationwide. Specifically, we identify the contribution of different consumer and business segments to this slowdown.
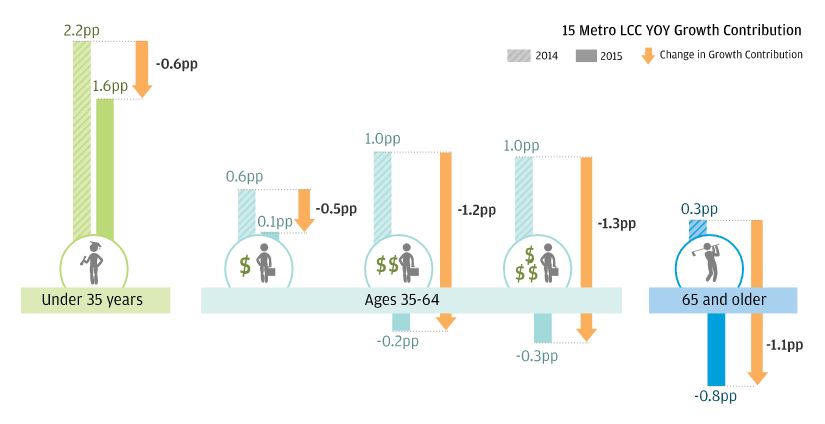
We attribute the slowdown in spending growth to higher—income and older consumers, whose spending fell significantly from a moderate level of growth. This contrasts with young consumers, whose spending continued to grow healthily, and with low-income consumers, whose spending slowed but is still rising.
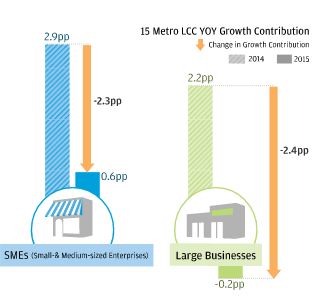
Spending growth at large businesses fell sharply, from an increase of nearly 7 percent from Q2 2013 to Q2 2014 to a decline of almost 1 percent from Q2 2014 to Q2 2015. Spending growth at small- and medium-sized enterprises also slowed, though to a lesser extent. However, SMEs account for nearly 70 percent of local consumer commerce sales. As a result, SMEs contributed nearly as much to the slowdown in growth of local consumer commerce as large businesses.
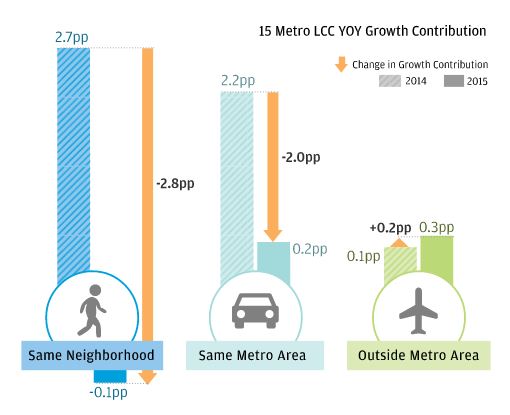
We attribute the slowdown in spending growth to considerably fewer purchases by residents from businesses in their neighborhood—spending plummeted from a 9 percent growth rate to zero. Purchases by residents from businesses within the same metropolitan area (but not in the same neighborhood) also fell, but not as steeply. In contrast, spending by out-of-town consumers rose, although they represent a much smaller share of total metropolitan area sales.
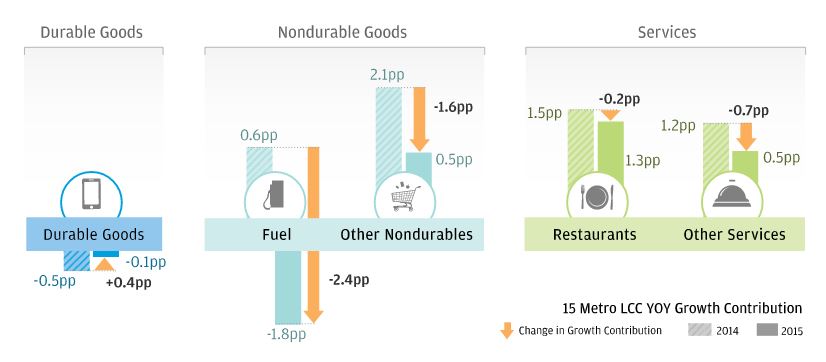
We attribute the slowdown in spending growth to businesses that sell fuel and other nondurable goods. While fuel was a small share of total spending, the sharp decline in gas prices contributed significantly to the overall slowdown in local consumer commerce. Nearly as important was a slowdown in spending on other nondurables, notably apparel, food, medical commodities, and recreational goods. Among these other nondurables, price declines contributed only to slowing spending on apparel, and just in part. Restaurants and other services continued to see moderate, but leveling, growth.
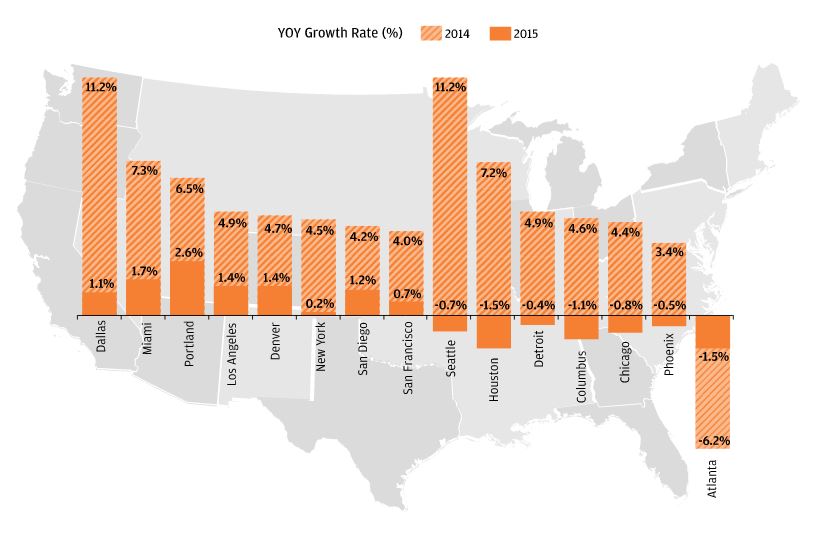
We find weaker spending in nearly all 15 metropolitan areas, with no city experiencing particularly strong growth. Local consumer commercial growth among the 15 cities ranged from -1.5 percent to 2.6 percent between Q2 2014 and Q2 2015. In contrast, spending growth rates rose in most of the cities between Q2 2013 and Q2 2014, with a range of 2.7 percent to 11.2 percent. Atlanta was the exception, showing a decline in local consumer commerce in both periods.
Our analyses show that changes in spending by higher-income older consumers played a major role in the slowdown of spending growth, as did spending at both SMEs and large businesses, spending on nondurable goods including but not limited to fuel, and spending by customers at the businesses closest to home. Over time, Profiles of Local Consumer Commerce will provide monthly data on commercial vibrancy at the national and city level and will be released on a quarterly basis. We hope our ongoing data series will serve as a rich platform to help answer important questions about the consumer sector, the dominant sector of the economy.


JPMorgan Chase & Co.'s website terms, privacy and security policies don't apply to the site or app you're about to visit. Please review its website terms, privacy and security policies to see how they apply to you. JPMorgan Chase & Co. isn't responsible for (and doesn't provide) any products, services or content at this third-party site or app, except for products and services that explicitly carry the JPMorgan Chase & Co.