We no longer support this browser. Using a supported browser will provide a better experience.
Please update your browser.
Daylight Saving Time (DST) is the adjusted time schedule that is followed in most states during the warmer months of the year to increase the amount of natural sunlight during the typical waking hours of the day. It begins in the spring when clocks are set forward from standard time by one hour and ends in the fall when clocks are returned to standard time.1 The policy affects over 300 million Americans. Notable exceptions include Arizona, Hawaii, American Samoa, Guam, the Northern Mariana Islands, Puerto Rico, and the Virgin Islands. Although DST was originally motivated by efforts to reduce energy costs, the economic impacts of DST have been difficult to evaluate.2
The energy saving rationale for DST has not been well supported by academic research.3 The benefits of reduced lighting costs are largely offset by increased air conditioning costs during the day and higher energy demands during the darker mornings of the DST period. There is a perception that DST increases spending among those consumers who make use of the extra daylight to frequent shops and restaurants, or spend money on outdoor recreation and other activities. The strongest advocates for the policy have been supporters of small businesses and retailers, like chambers of commerce and outdoor entertainment providers like the golf and barbecue industries.4
In advance of the return to Standard Time this November, the JPMorgan Chase Institute used its unique lens to measure the impacts of DST on consumer spending. Specifically, we sought to test whether or not DST provides the benefits that advocates advance in support of the policy. Using an anonymized sample of daily credit and debit card transactions, we compared consumer spending in Los Angeles, a city that observes DST, to that of Phoenix, a city that does not observe DST. We chose Los Angeles as our comparison city because of its relative proximity to Phoenix, relative stability of climate during the study window, and the robust volume of spending we could observe in both cities. The sample for this study draws from over 380 million transactions made by over 2.5 million anonymized customers.
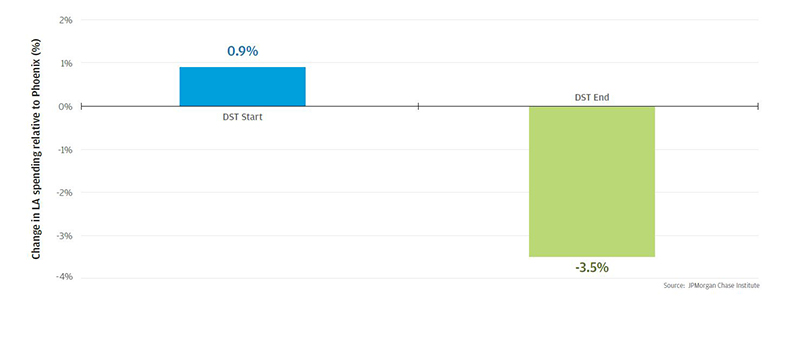
Our unprecedented view of spending around the beginning and end of DST does not support consumer spending claims of DST advocates. Our analysis finds the policy is associated with a 0.9 percent increase in daily card spending per capita in Los Angeles at the beginning of DST and a reduction in daily card spending per capita of 3.5 percent at the end of DST. The increase in spending at the beginning of DST is determined by comparing daily card spending per capita in the 30 days before DST starts, to daily card spending per capita in the 30 days after DST starts. The decrease at the end captures a similar window to compare spending in the 30 days before and after the end of DST. Most of the impact stems from responses at the end of DST, when spending on goods drops more than spending on services, and spending during the work week drops more than weekend spending. The magnitude of the spending reductions outweighs increased spending at the beginning of DST.
DST begins in March and ends in November, which means there are two relevant events to capture when measuring the impact of the policy. In March, Los Angeles enters DST while Phoenix does not. Consequently, Los Angeles has an additional hour of post-work sunlight while Phoenix remains unchanged. If the extra hour induces additional spending, we would expect to see an increase in local commerce in Los Angeles relative to local commerce in Phoenix. In November, the opposite should happen. Los Angeles would lose an hour of post-work sunlight, and we would expect to see local commerce in Los Angeles decline relative to local commerce in Phoenix.5
Using daily transaction-level data in the two cities, we found that the onset of DST has a positive effect on local commerce.6 Los Angeles sees a 0.9 percent increase in daily card spending per capita in the 30 days after gaining an hour of post-work daylight. However, in the 30 days after DST ends, daily card spending per capita in Los Angeles declines 3.5 percent relative to spending in Phoenix. There are two channels by which such a decline could occur: consumers could either make fewer trips to merchants (reflected in fewer transactions) or spend less money per transaction. In our data, over two-thirds of the decline is due to a reduction in the number of transactions, which is consistent with the idea that daylight affects the decision to go to the store.
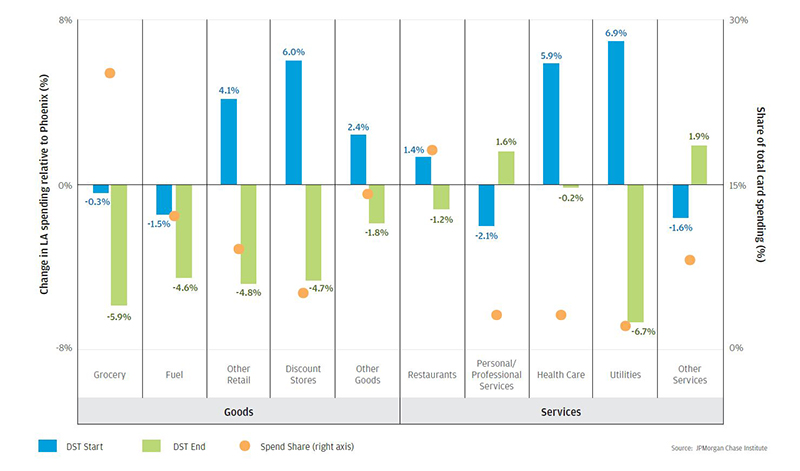
The end of DST affects different product types to different degrees. Grocery stores are most affected, losing almost 6 percent of daily retail per capita spend at the end of DST. Fuel, other retail, and discount stores each lose over 4.5 percent. By contrast, changes in restaurants, personal/professional services7, and health care spending are notably smaller in magnitude. Utilities are an outlier in the services space, but they represent just 2 percent of total spending.
There are a number of reasons the services highlighted here might be less reliant on daylight than other categories of expenditure. Restaurants are often patronized at night and are often visited by multiple consumers who coordinate their visits. Personal/professional services and healthcare have little reason to respond to DST, and likely capture time-of-year effects (e.g. allergy season) more than discretionary choices related to taking advantage of sunlight. For this reason, we did not expect large changes in these categories. Utility spending, by contrast, might be responding to DST insofar as it alters the energy consumption choices. On the other hand, the most affected goods providers carry products that often require no coordination on the part of the consumer and are often impulse purchases.
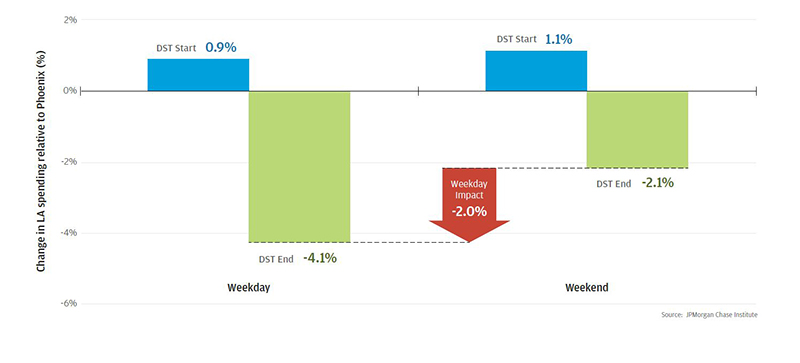
There are large differences in spending changes across days of the week. Increases in card spending at the beginning of DST are virtually the same for weekdays and weekends in Los Angeles. However, spending during the work week declined significantly more than spending during the weekend at the end of DST. This finding is consistent with the idea that consumers with jobs may have limited time to shop during the work week. If daylight affects the decision to patronize a merchant, we would expect that losing an hour of daylight would have a larger effect when there are fewer hours available. Conversely, since most consumers do not work on the weekends, they have the freedom to engage in commerce over a far greater range of times on Saturdays and Sundays.
Daylight Saving Time has been advanced as a policy that both saves energy and increases consumer spending. In this brief, the JPMorgan Chase Institute has explored whether or not the latter claim is supported by evidence. We found that card spending in Los Angeles experienced a relative increase of 0.9 percent in the 30 days following the start of DST, and experienced a relative decline of 3.5 percent in the 30 days following the end of DST.
Though we have focused on the comparison to Los Angeles, note that the analysis should be correctly interpreted as one such comparison. We also compared San Diego and Denver to Phoenix to check the robustness of our result. The start and end of DST in San Diego were associated with a relative increase of 2.9 percent and a relative decrease of 2.2 percent in card spending, respectively. In Denver, the relative increase at the start of DST was 0.8 percent, while the relative decrease at the end was 4.9 percent. These comparisons indicate that economic impact of DST is not uniform, and the impact on a given city is an empirical question.
To place these numbers in context, it is useful to consider the impact of a policy that was specifically designed to increase consumer spending. Agarwal and McGranahan (2012) explores sales tax holidays on specific items like clothing and footwear in over 20 states. They find that sales tax holidays boost daily spending on targeted goods by 8 percent, but the holidays last for only three days, muting the long-term effects. Assuming constant spending each day, an 8 percent increase in spending for 3 days translates to a 0.8 percent increase in spending over 30 days. The effect of the start of DST in Los Angeles was to increase daily card spending per capita by 0.9 percent over a 30 day period, an amount that is comparable to the sales tax holiday. Moreover, this effect spans many classes of goods. The effect at the end of DST, however, is a much larger decrease in spending at -3.5 percent. In other words, DST inadvertently has a deeper and broader effect in Los Angeles on spending than a policy specifically designed to stimulate spending.
It is important to note that there are other reasons to support DST beyond the impacts on consumer spending. To the extent that DST increases the amount of daylight available in the evening, it might make it more difficult for criminals to operate. It is plausible that cities that utilize DST may see some benefit from the perspective of public safety. Alternatively, residents may simply enjoy having the additional daylight. In any evaluation of the policy, consumer spending is one among a set of considerations.
Daylight Saving Time is a live issue, as evidenced by the recent debate over a bill (Assembly Bill 385) designed to end the practice in California. To the extent possible, such debates should be driven by empirical evidence. Our analysis suggests that it is far from a given that local commerce will benefit.
The JPMorgan Chase Institute conducted the analyses in this brief using anonymized data on credit and debit card transactions in the cities of Los Angeles and Phoenix from October 2012 to June 2015. The sample is restricted to dates that fall within 30 days of the start (early February to early April) or end (early October to early December) of DST each year, leaving a total of four time-change episodes of each kind. In order to focus on customers whose credit and debit card spend is meaningfully large, customers must have at least five transactions in the 30 days before or after a particular time change in a given year to be retained in the sample for that year. After applying these filters, the final sample of data captures the spending behavior of over 450,000 anonymized customers transacting in Los Angeles and Phoenix.
The empirical methodology for estimating the effect of DST is a modified difference-in-differences. To illustrate the approach, the measurement of the effect for the end of DST is as follows. For each of the years in which the end of DST is observed (2012-2015), daily card spending per capita is calculated for each combination of city and time period:
The end of DST is an annual event that appears four times in our data, and each of the above measures is averaged across all four years. To a first approximation, the modified difference-in-differences estimate is calculated in two stages. The first involves capturing the growth in daily card spending per capita in Los Angeles (A/B - 1) and the growth in daily card spending per capita in Phoenix over the same period (C/D - 1).8 In the second stage, the ratio of these growth rates is calculated. The result can be thought of as the difference in the growth rates between the “treatment group” (i.e. Los Angeles, which observes DST) and the “control group” (i.e. Phoenix, which does not observe DST).9 This difference can be interpreted as the causal impact of the end of DST on daily spending.
In the case of the end of DST, this effect is -3.5 percent in Los Angeles, which represents the decline in growth of daily card spending per capita that results from the lost hour of sunlight after DST ends. The same methodology can be employed for the beginning of DST. In that case the effect is 0.9 percent, which represents the increase in growth of daily card spending per capita that results from the extra hour of sunlight after DST begins. This result holds up against robustness checks for “day of week” effects10 and potentially different growth profiles across the two cities.
Downing, M. (2005). Spring Forward: The Annual Madness of Daylight Saving Time. Counterpoint Publishing.
Graziani, G., van der Klaauw, W., & Zafar, B. (2013). A Boost in the Paycheck: Survey Evidence on Workers' Response to the 2011 Payroll Tax Cuts. New York: Federal Reserve Bank of New York.
Kotchen, M. J., & Grant, L. E. (2011). Does Daylight Saving Time Save Energy? Evidence from a Natural Experiment in Indiana. The Review of Economics and Statistics, 93(4), 1172-1185.


JPMorgan Chase & Co.'s website terms, privacy and security policies don't apply to the site or app you're about to visit. Please review its website terms, privacy and security policies to see how they apply to you. JPMorgan Chase & Co. isn't responsible for (and doesn't provide) any products, services or content at this third-party site or app, except for products and services that explicitly carry the JPMorgan Chase & Co.